Currency
January 02, 2024
New report from ISN shows 20,000 hospitalizations, 3,154 amputations and 871 fatalities. over past 6 years.
In a new report from ISN, Serious Injuries and Fatalities (SIFs), an analysis of more than 127,000 recordable incidents from 2017-2022 showed nearly 24,000 SIFs cases.
This incoluded more than 20,000 hospitalizations, 3,154 amputations and 871 fatalities.
Over the data’s six-year span, an interesting trend was identified with hospitalization cases. The COVID-19 outbreak in 2020 resulted in elevated hospitalization cases despite the downturn in work activity; for 2022, however, ISN’s analysis shows a stabilization of cases with statistics that begin to return to pre-pandemic data sets.
In addition, 2022 saw the lowest number of amputation cases in the last six years. Unfortunately, however, the number of fatalities drastically increased.
HIghlights from the report include:
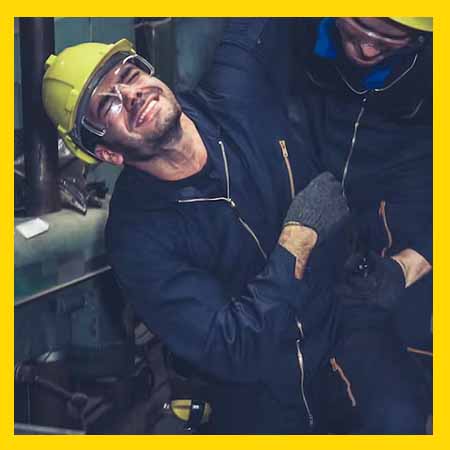
Sprains, Strains and Tears return as No. 1 incident category amid an aging workforce: After an anomaly in 2021, 2022 data shows a return of Sprains, Strains and Tears as the No. 1 incident reported by contractors from all industries, replacing Fractures and Dislocations. This can be correlated with an aging workforce. According to the Bureau of Labor Statistics (BLS), the employment of workers aged 75 years and older is expected to grow by 96.5% over the next decade. As older workers are more prone to injuries through falls, tailoring occupational safeguards around this aging workforce demographic will be key to decreasing the number of Sprains, Strains and Tears among workers.
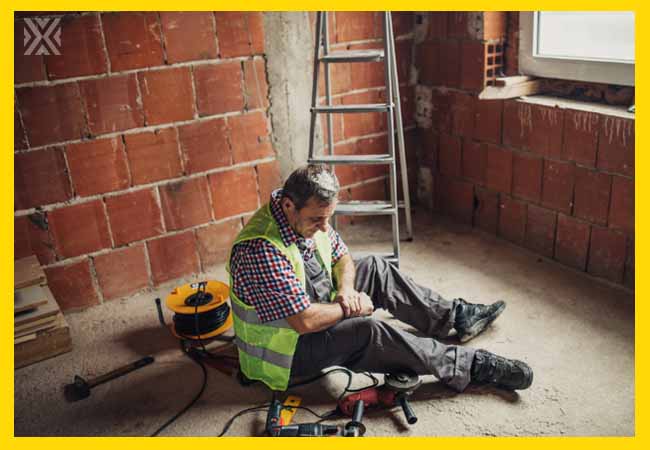
Contact with Object or Equipment was the most common cause of fatalities in 2022: As workforces ramped back up to pre-pandemic capacity, several factors played into fluctuations in SIF data for 2022, including a stabilization of exposure hours, temporary and new workforces, as well as a re-learning period from significant dips in work activity. 2022 saw a drastic increase in the number of fatalities, with the top three causes including Contact with Object or Equipment (55%), Trips, Slips and Falls (21%), and Overexertion & Bodily Reaction (13%).
Mid-size corporations experience the highest rates of fatalities: ISN’s analysis also considered the connection between company size and the likelihood of a SIF occurrence. Interestingly, the highest rate of fatalities is not correlated with the largest company size, but rather mid-size corporations. Much like Total Recordable Incident Rate (TRIR), smaller companies who have a SIF event occur are seeing the biggest impact in their overall SIF rate for each SIF event. Regardless of company size, SIFs have a significant impact on both the affected individual and the organization.
Analysis of SIFs by Industry
The report focused on transportation, oil and gas, manufacturing, mining and utilities as these are among the top industries for total deaths and life altering events. Highlights from the industry-specific analysis include:
Transportation: Human factors continue to be an overwhelming contributor to transportation related deaths. Based on job titles, drivers were the second most likely group to experience a SIF event. Additionally, Transportation averaged the second highest average Days Away from Work in 2022 at 95 days per case.
Oil and Gas: Oil and Gas operations can be classified into sectors with varying tasks and hazards in each. The Upstream-Onshore sector had the highest industry fatality rate at 9.5 (per 100,000 workers). ISN also analyzed job titles commonly associated with reported SIF cases in Oil and Gas and identified that technicians, laborers and floormen consistently make up the top categories year after year.
Manufacturing: Even with the wide variety of hazards and risks in the Manufacturing industry, ISN’s analysis shows that overall SIF rates have been below average compared to other industries. Also in contrast to other industries, the most affected body part in the Manufacturing industry was Lower Extremities.
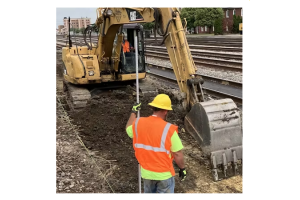
Mining: 89% of all SIF cases for Mining in 2022 were classified as Days Away from Work. In addition, each of these cases has an average of 88 days (about 3 months) away from the job, resulting in a significant number of injured workers not actively performing work.
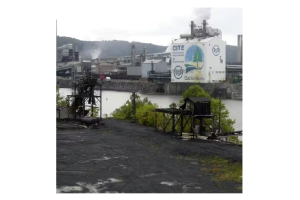
Utilities: The Utilities industry has moved the needle in the health and safety space regarding implementation of leading indicators and high-hazard work analysis. It consistently accounts for less than 1% of total SIFs reported month over month. While serious events are occurring, it is at a lower rate than many other industries.
In a new report from ISN, Serious Injuries and Fatalities (SIFs), an analysis of more than 127,000 recordable incidents from 2017-2022 showed nearly 24,000 SIFs cases.
This incoluded more than 20,000 hospitalizations, 3,154 amputations and 871 fatalities.
Over the data’s six-year span, an interesting trend was identified with hospitalization cases. The COVID-19 outbreak in 2020 resulted in elevated hospitalization cases despite the downturn in work activity; for 2022, however, ISN’s analysis shows a stabilization of cases with statistics that begin to return to pre-pandemic data sets.
In addition, 2022 saw the lowest number of amputation cases in the last six years. Unfortunately, however, the number of fatalities drastically increased.
HIghlights from the report include:
Sprains, Strains and Tears return as No. 1 incident category amid an aging workforce: After an anomaly in 2021, 2022 data shows a return of Sprains, Strains and Tears as the No. 1 incident reported by contractors from all industries, replacing Fractures and Dislocations. This can be correlated with an aging workforce. According to the Bureau of Labor Statistics (BLS), the employment of workers aged 75 years and older is expected to grow by 96.5% over the next decade. As older workers are more prone to injuries through falls, tailoring occupational safeguards around this aging workforce demographic will be key to decreasing the number of Sprains, Strains and Tears among workers.
Contact with Object or Equipment was the most common cause of fatalities in 2022: As workforces ramped back up to pre-pandemic capacity, several factors played into fluctuations in SIF data for 2022, including a stabilization of exposure hours, temporary and new workforces, as well as a re-learning period from significant dips in work activity. 2022 saw a drastic increase in the number of fatalities, with the top three causes including Contact with Object or Equipment (55%), Trips, Slips and Falls (21%), and Overexertion & Bodily Reaction (13%).
Mid-size corporations experience the highest rates of fatalities: ISN’s analysis also considered the connection between company size and the likelihood of a SIF occurrence. Interestingly, the highest rate of fatalities is not correlated with the largest company size, but rather mid-size corporations. Much like Total Recordable Incident Rate (TRIR), smaller companies who have a SIF event occur are seeing the biggest impact in their overall SIF rate for each SIF event. Regardless of company size, SIFs have a significant impact on both the affected individual and the organization.
Analysis of SIFs by Industry
The report focused on transportation, oil and gas, manufacturing, mining and utilities as these are among the top industries for total deaths and life altering events. Highlights from the industry-specific analysis include:
Transportation: Human factors continue to be an overwhelming contributor to transportation related deaths. Based on job titles, drivers were the second most likely group to experience a SIF event. Additionally, Transportation averaged the second highest average Days Away from Work in 2022 at 95 days per case.
Oil and Gas: Oil and Gas operations can be classified into sectors with varying tasks and hazards in each. The Upstream-Onshore sector had the highest industry fatality rate at 9.5 (per 100,000 workers). ISN also analyzed job titles commonly associated with reported SIF cases in Oil and Gas and identified that technicians, laborers and floormen consistently make up the top categories year after year.
Manufacturing: Even with the wide variety of hazards and risks in the Manufacturing industry, ISN’s analysis shows that overall SIF rates have been below average compared to other industries. Also in contrast to other industries, the most affected body part in the Manufacturing industry was Lower Extremities.
Mining: 89% of all SIF cases for Mining in 2022 were classified as Days Away from Work. In addition, each of these cases has an average of 88 days (about 3 months) away from the job, resulting in a significant number of injured workers not actively performing work.
Utilities: The Utilities industry has moved the needle in the health and safety space regarding implementation of leading indicators and high-hazard work analysis. It consistently accounts for less than 1% of total SIFs reported month over month. While serious events are occurring, it is at a lower rate than many other industries.
SOURCE:
https://www.ehstoday.com/safety/article/21279532/new-injuries-and-fatalities-data
Recent Posts


Popular Posts